data_dir = 'https://mdporter.github.io/teaching/data/' # data directory
library(tidyverse) # functions for data manipulationSYS 6018 | Spring 2025 | University of Virginia
Homework #0: Hello SYS-6018
Required R packages and Directories
Getting Help
The purpose of this (ungraded) homework is to help get you prepared for the semester. Don’t panic if you don’t immediately know the answers to some of these. I expect everyone will need to look things up. Take note of the areas that are rusty and plan to spend a bit of extra time to get up to speed. If some of these items are not even remotely familiar to you, then you probably have not satisfied the pre-requisite material; review the course syllabus and speak to me about any questions.
The teaching staff (TA and myself) are here to help! Don’t wait too long before asking for help and do let us know right away if you are starting to fall behind. I will also publish the solutions after due date. It is highly encouraged that you study the posted solutions.
Required R Resources
a. Update R, RStudio, and Quarto
Use the latest version (R 4.4.2, RStudio 2024.09.0+375, Quarto 1.5.56)
Installation help
b. Install and Update packages
Install/Update the following packages we will meet during this course:
- Dynamic report generation:
rmarkdown,knitr,quarto - Utility:
remotes - Working with Data:
tidyverse - Data:
ISLR,moderndive,MASS,mlbench,modeldata - Resampling:
boot,rsample - Modeling:
tidymodels,modelr,broom,splines - Regression:
glmnet,FNN,mgcv - Classification:
e1071,kernlab - Trees:
rpart,rpart.plot,randomForest,ranger,lightgbm,bonsai - Ensembles:
gbm,xgboost - Density Estimation:
fitdistrplus,ks - Clustering:
mclust,mixtools,dbscan - Association Analysis:
arules - Networks:
igraph - Forecasting:
fpp3
You can see which of your existing packages need updating by running:
old.packages() %>% as_tibble()Or use the update.packages() function to update them.
Note: Do not call install.packages() in this Quarto document; it only needs to be done once from the console. However you will need to use library() in Quarto since that needs to be called every time the document is compiled.
c. Install the course quarto extension
This document will not compile until you load the sys6018hw-html quarto extension. To do this, open a terminal window (if using RStudio, look for the terminal tab) and navigate to the same directory where this file is. Then run:
quarto add mdporter/quarto-sys6018-hwwhich should create an _extensions directory (if connected to the internet). This contains the formatting for the compiled html document.
Tidyverse Resources
Read the following sections in R for Data Science 2e:
- The Whole Game
- Chapters 2-9
- Visualize
- Chapters 10-12
- Transform
- 12-15, 19
- Program
- 26-27
- Communicate
- 29
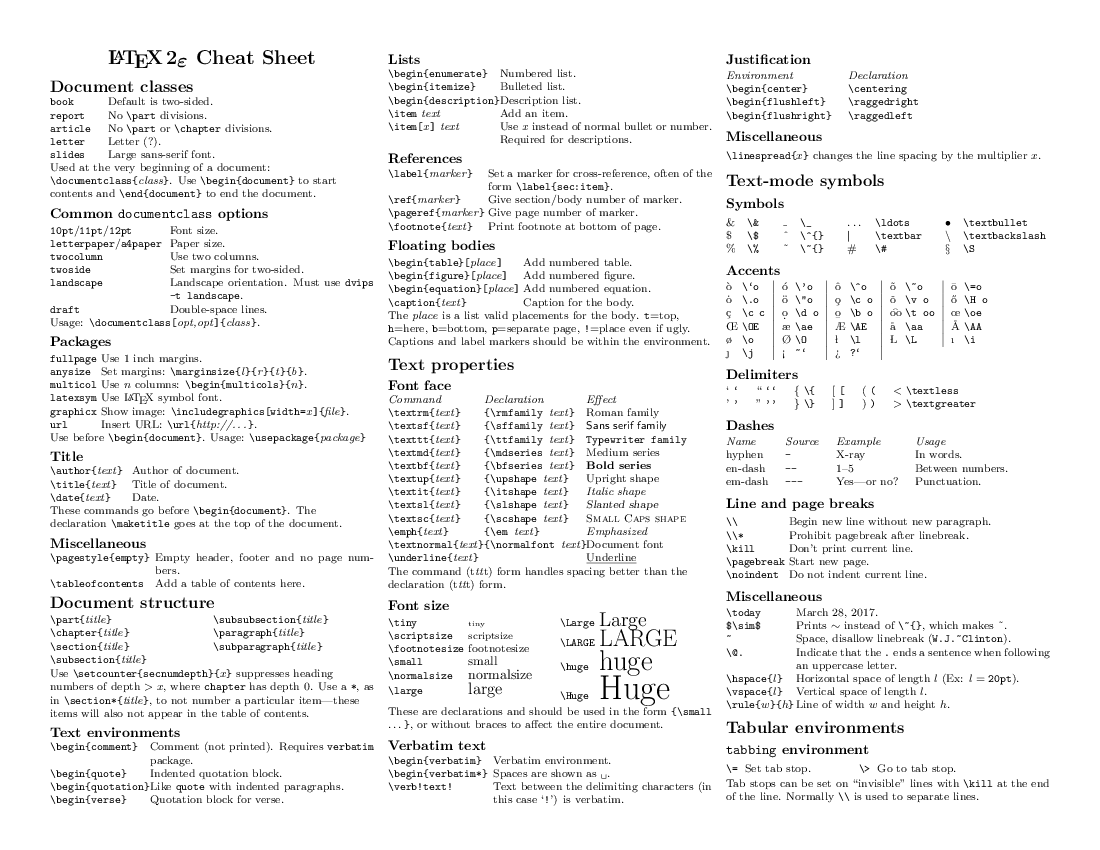
Save/Bookmark the following cheatsheets and resources
RStudio and Quarto
R
Python with RStudio/RMarkdown (Optional)
Problem 1: Math Notation
a. OLS coefficients
What are the equations for the least squares coefficients in linear regression (in matrix notation)? Use \(X\) for the model/design/predictor matrix, and \(Y\) the vector of outcomes.
b. Maximum Likelihood
Let \(x_1, x_2, \ldots, x_n\) be a sample of length of time that a customer is on the phone with a call center help line. We feel comfortable modeling the data as coming from an exponential distribution. What is the MLE (Maximum Likelihood Estimate) of the parameter? Show your steps.
Problem 2: Coding Practice
a. Simulate
Simulate 100 observations from the following model:
- \(X \sim N(1, 1)\)
- \(Y \sim N(1 + 2X, 2)\)
- \(Z = \begin{cases} 1 &\quad Y<0 \\ 2 &\quad Y \ge 0 \end{cases}\)
b. Scatterplot
Make a scatter plot of the data. Put \(X\) on the x-axis and \(Y\) on the y-axis. Color the points according to \(Z\).
c. Function
Write a function that adds two numbers together and squares the result.
d. Loop
Write a loop to calculate the mean of every column in (the built-in data) mtcars.
Problem 3: Statistics
a. Quantiles
Find two quantiles that capture 95% of the following data:
set.seed(2022)
x = runif(n=100, min=2, max=22)b. Confidence Interval
A new machine learning model, developed by UVA researchers, uses biopsy images to predict if a child has enteropathy or celiac disease. In a study of 102 patients, the model was able to correctly classify 95 of the images.
Find the 90% confidence interval for the probability a patient is correctly classified?
c. Linear Models
- Albemarle County, VA real estate assessment data can be found at this link. Data collected by UVAs StatLab as part of the PhDplus program (https://github.com/uvastatlab/phdplus).
Fit a linear regression model that predicts the
totalvalueusing the predictors:condition, size (finsqft), and location (city).What are the estimated coefficients?
What is the estimated
totalvaluefor home with the following characteristics?
| finsqft | city | condition |
|---|---|---|
| 2500 | EARLYSVILLE | Good |
| 1850 | CROZET | Fair |
d. Hypothesis Testing
Use the movies_sample (IMDb) data from the moderndive R package to performance a hypothesis test that Action movies are ranked lower (on average) than Romance movies.